Updated Activity Analysis, 2.1

Updated version of the Activity Analysis toolbox is up on GitHub now. The changes in functions came from working with more psychophysiological measurements and events. Now there is an option to assess the coordination score for a response collection using the distributions of local rank in activity levels, instead of the distribution of activity levels themselves. For more on Activity Analysis generally, check out this post on the paper that was published earlier this year, including a link to the full text pdf.

This addition may seem like a tiny adjustment. For many kinds of response events, it doesn’t substantially change alignment assessments. When considering the coordination of events that are fairly consistent in rate over time, like say inspiration onsets, the distributions of activity levels and of local rank give the same kinds of coordination scores. However, for response events that change their rate of occurance over the course of a piece of music, like skin conductance increases, the activity level time series distribution obscures moments of exceptional alignment in quieter times. In such cases, the local rank does a better job at capturing anomalous alignments.

This rank based coordination score appeared to be necessary when I was testing unrelated response collections of facial sEMG signals and skin conductance. The old calculation generated scores that were too low, producing insufficient numbers of false positives, while this adjustment behaved just as the statistic should.

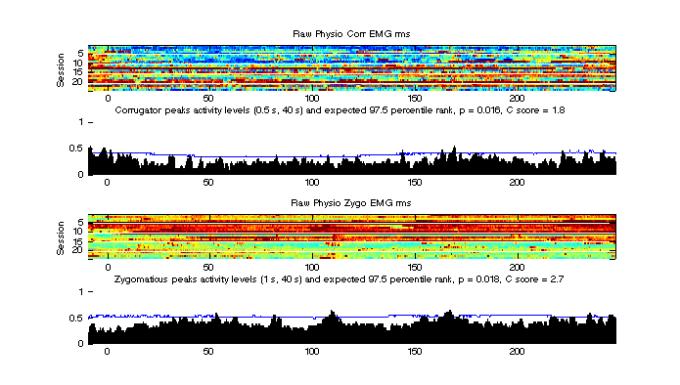
Besides this change to the localActivityTest function outputs, a few other functions have been tweaked and the demos have been amended to work with these changes. Lastly, Demo_2 now include coordination assessments on a number psychophysiological signals recorded during 24 listenings to a fun piece of music by a single participant.

It all should work just fine in MatLab.

I’m looking forward to releasing this version in Python in the not too distant future too.

PhD Defended

On June 21st, 2018, I successfully defended by doctoral dissertation, Detection of Respiratory Phase Adaptation to Heard Music.  Without a doubt, listeners do subtly and subconsciously adjust when they breathe to fit with music, lining up specific respiratory phases to specific moments, but this happens under limited conditions. Only some moments of music draw respiratory phase alignment, and some people show stronger susceptibility to music’s coordinating influence.

With the extra three months granted by my committee, my quantitative analysis of listener respiration was extended with qualitative analysis of alignment patterns in repeated response studies and audience experiments. Activity analysis identified moments of exceptional phase alignment and music theory enriched my interpretation of the corresponding stimulus. Out of 36 pieces of music, 21 provoked identifiable moments of alignment and out of these arose four theories of how listeners’ breathing could be drawn or cued by what they heard:

  • Embodied perception/motor imagery: Some listeners toke inspirations when they might have, were they performing the music. This happens to vocal music, whether or not the performers’ breaths could be heard in music recordings. Examples from one case study participant can be seen in the attached figure, with inspirations (blue stars on chest expansion measurements) coinciding with performer inspirations during this a cappella folk song (highlighted in red on sound wave).
  • Inspiration suppression for attentive listening: The noise of inspiration and expiration can get in the way of auditory attention and there are (rare) moments in music when listeners seem to delay breathing in or out so as to hear better. A moment like this is also in the attached figure, with post-expiration pauses extended from 97.4 s.
  • Respiratory marking of salient moments: Listeners would sometimes breath in our out with recurring elements of musical motives, as if acting with something important or familiar. This was more common in structurally complex music and moments of strong affect, such as powerful lyrics, increasing tension, or exceptional aesthetics.
  • Post-event respiratory reset: In a few cases, well timed respiration cycles occurred after events, like after the last line of a song. This is reminiscent of relaxing sighs and similar actions through to help the respiratory system reset back to normal relaxed quiet breathing.

Causal mechanisms for these four theories are suggested by current respiration and music cognition research, however they each require further exploration on experimental data beyond what was studied here. And it is also possible they might arise more frequently than could be captured by these statistics, limited as they are to behaviour that co-occurs with the music at least 20-40% of the time. Between a theorize mechanism and well designed experiments, it may yet be possible to detect these deviation in action, giving us further clues into how listeners are engaging with the music they hear.

More details to come in the shape of my final dissertation document. To be completed in the next month or so.

Activity Analysis published in Music Perception

The Activity Analysis paper has been published in Music Perception!

Titled “Activity Analysis and Coordination in Continuous Responses to Music”, this paper explains what we can learn about the consistency of activity in continuous responses to music using the example of Continuous Ratings and (with the appendicies) all the technical details behind the results.

Abstract: Music affects us physically and emotionally. Determining when changes in these reactions tend to manifest themselves can help us understand how and why. Activity Analysis quantifies alignment of response events across listeners and listenings through continuous responses to musical works. Its coordination tests allow us to determine if there is enough inter-response coherence to merit linking their summary time series to the musical event structure and to identify moments of exceptional alignment in response events. In this paper, we apply Activity Analysis to continuous ratings from several music experiments, using this wealth of data to compare its performance with that of statistics used in previous studies. We compare the Coordination Scores and nonparametric measures of local activity coordination to other coherence measures, including those derived from correlations and Cronbach’s α. Activity Analysis reveals the variation in coordination of participants’ responses for different musical works, picks out moments of coordination in response to different interpretations of the same music, and demonstrates that responses along the two dimensions in continuous 2D rating tasks can be independent.

Download the PDF (Upham_McAdams_2018_ActivityAnalysis) and get the MatLab toolbox to use this technique on more continuous response data.

Million thanks to my co-author and mentor, Prof. Stephen McAdams, whose steadfast support made this work possible, and the patience of our editor at Music Perception, Prof. David Temperley.

The Solo Response Project – track-wise analysis

In the Solo Response Project, I recorded my own responses to a couple dozen pieces of music everyday for most of a month, self report and psychophysiological, to generate a data set that would let me compare experiences as captured through these measurement systems. The data set has mostly been used behind the scenes to tune signal processing and statistics, but there is plenty to learn about the music as well, given how I reacted to these stimuli.

On the project website, there is now a complete set of stimulus-wise posts sharing plots of how I responded to these pieces of music as they played and over successive listenings. Each post includes a recording of the stimulus (more or less), and figures about each of:

  • Continuous felt emotion ratings,
  • facial surface Electromyography (Zygomaticus and Corrugator) and of the upper Trapezius,
  • Heart rate and Respiration rate,
  • Respiration phases,
  • Skin Conductance and Finger Temperature.

The text doesn’t explain much but those familiar with any of these signals will find it interesting to see how a single participant’s responses can vary over time.  Some highlights from the amalgam above (left to right, top to bottom):

  1.  The familiar subito fortissimo [100s] and continued thundering in O Fortuna from Carmina Burana is so effective that my skin conductance kept peaking through that final section. (At least on those days when GSR was being picked up at all.)
  2. Some instances of respiratory phase aligning were unbelievably strong, for example to Theiving Boy by Cleo Laine [85s].
  3. Evidence that I still can’t help but smile at the way Charles Trenet pronounces the word play in “Boum!” (“flic-flac-flic-flic” [60s])
  4. Self-reported felt emotional responses can change from listening to listening, particularly to complex stimuli like Beethoven’s String Quartet No. 14 in C-sharp minor.
  5. Finger temperature plunging [130s] with the roaring coda [118s] in the technical death metal piece of Portal by the band Origin
  6. Respiration getting progressively slower at the end [90s] of a sweet bassoon and harp duet by Debussy called Romance.

There is still a lot to say about the responses to the 25 stimuli used in this project, but as always, anyone is welcome to poke through the posts to look, listen, and consider what might be going on.

Activity Analysis Paper

With great relief, I can say that the Activity Analysis paper for Music Perception has been accepted for publication! I don’t know exactly when it will come out but here are the essential components:

Activity Analysis and Coordination in Continuous Responses to Music

by Finn Upham and Stephen McAdams

Abstract

Music affects us physically and emotionally. Determining when changes in these reactions tend to manifest themselves can help us understand how and why. Activity Analysis quantifies alignment of response events across listeners and listenings through continuous responses to musical works. Its coordination tests allow us to determine if there is enough inter-response coherence to merit linking their summary time series to the musical event structure and to identify moments of exceptional alignment in response events. In this paper, we apply Activity Analysis to continuous ratings from several music experiments, using this wealth of data to compare its performance with that of statistics used in previous studies. We compare the Coordination Scores and nonparametric measures of local activity coordination to other coherence measures, including those derived from correlations and Cronbach’s α. Activity Analysis reveals the variation in coordination of participants’ responses for different musical works, picks out moments of coordination in response to different interpretations of the same music, and demonstrates that responses along the two dimensions in continuous 2D rating tasks can be independent.


Download the Author’s Version (pdf, 4MB) and check out the latest version of the Activity Analysis Matlab Toolbox (Github, download files directly)

Besides vast improvements in terms of writing style and the like, this version also includes a quick comparison of ratings to two performances of the same piece. Here is the figure related to that analysis.

Arcadelt_EmotionalArousal_Inc.jpg
FIGURE 8. Continuous ratings of felt emotional arousal ratings to two different interpretations of the Renaissance madrigal Il blanco e dolce cigno by J. Arcadelt. A) 30 ratings (Rsp (Rec)) and their average times series (Avg) to a recording by the King’s Singers, plotted in metrical time and C) 17 ratings (Rsp (Rec)) and their average (Avg) to a live performance by the semi-professional choir, the Orpheus Singers, plotted in metrical time. B) The activity levels of rating increases (minimum 2.5% in 2-s time frames) on overlapping time frames, aligned in metrical time, of ratings to the recording above (Rec (inc)) (max NPC Score, 3.3), and to the live performance below (Live (inc)) (max NPC score, 3.3), with time frames of locally extreme high and low activity levels (X-Act) marked in grey circles and black diamonds.