Virtual ISMIR 2020, Exit report

This last year, I served virtual technology chair for the 21st meeting of the International Society for Music Information Retrieval ISMIR 2020, a position deemed necessary when COVID-19 lockdowns began to spread. The transformation of a week-long in person conference to a week-long 24 hr virtual meeting required a whirlwind of effort from all the organisers, and to sum up the lessons learned, we have compiled an exit report (pdf). The document lays out what technologies were used, how events were scheduled, instructions shared with participants, and details from many individual chairs on how they adapted their responsibilities. Also included is an analysis of how attendees actually used the platforms, looking at attendance numbers per event time and type, and a report on participants experiences shared via a post-conference survey. 

The 40+ page report (pdf) may be of interest to anyone coordinating their first virtual academic conference and to researchers looking at how research communities are adapting to the current circumstances. To share a taste of what we learned, here are some highlights from the analysis of registration statistics, virtual platform usage, and the post-conference survey responses.

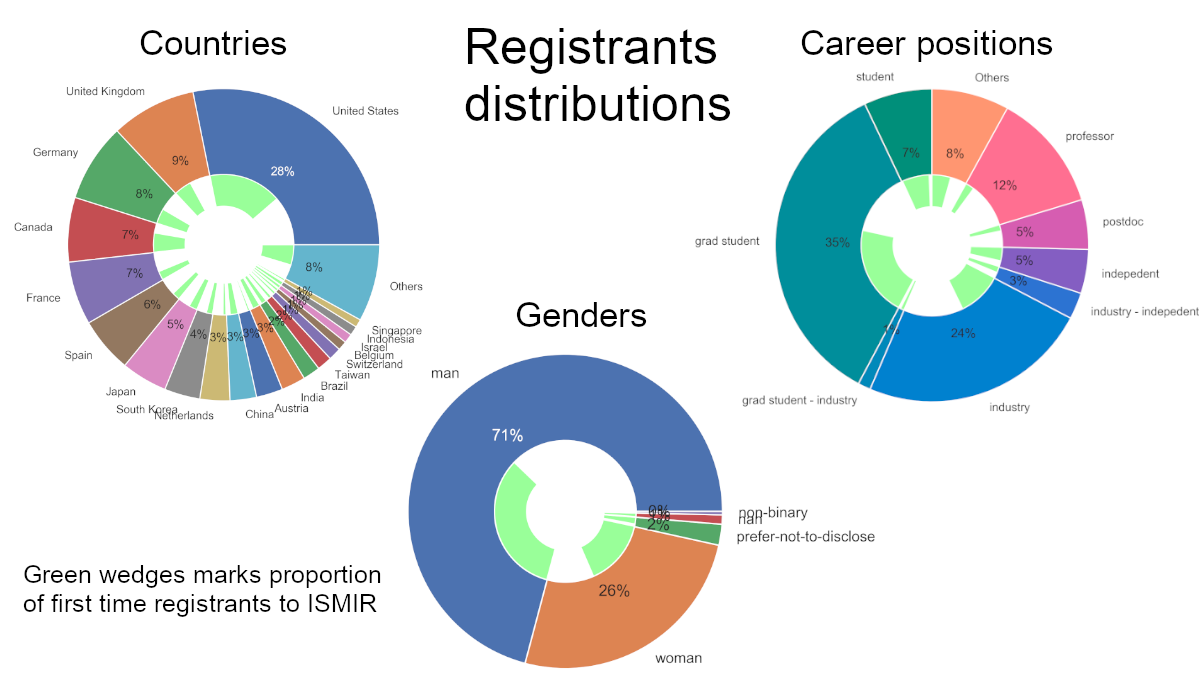
The virtual format allowed many more people to attend ISMIR than usual. In a conferences that normally sees 400 participants, we had over 800 sign up, with half of the registrants attending for the first time. In the report, we break down the distribution of registrants across a number of categories, below are the stats by country of residence, gender, and career position. The inset green wedges shows the proportion of first time attendees per category. Some of these ratios are to be expected, say the high proportion of grad students attending for the first time, others are more informative like the higher ratio of new women registrants than of new men.

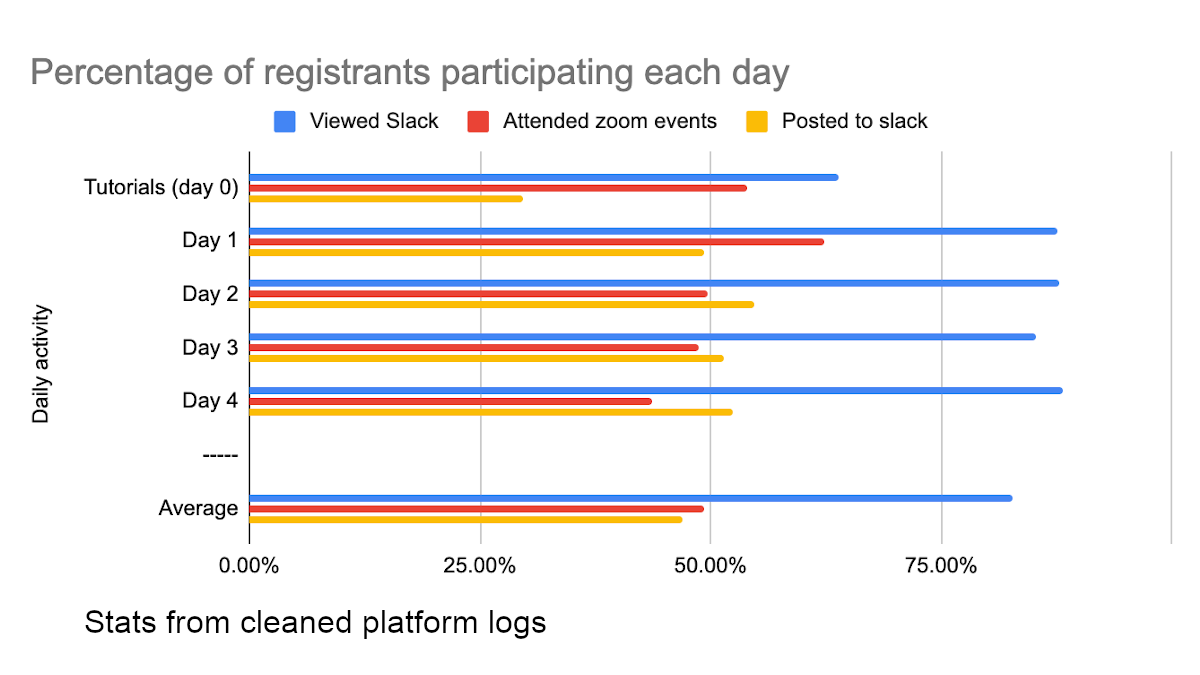
With so many people registering, it was hard to know how many to expect in attendence at specific events. Attrition is very high for virtual events, particularly if registration is relatively low cost. Participation at any given conference event was split by our 24 hr doubled schedule, but careful review of the platform statistics found the vast majority of registrants visited the conference slack daily while ~50% commented and attended zoom events.

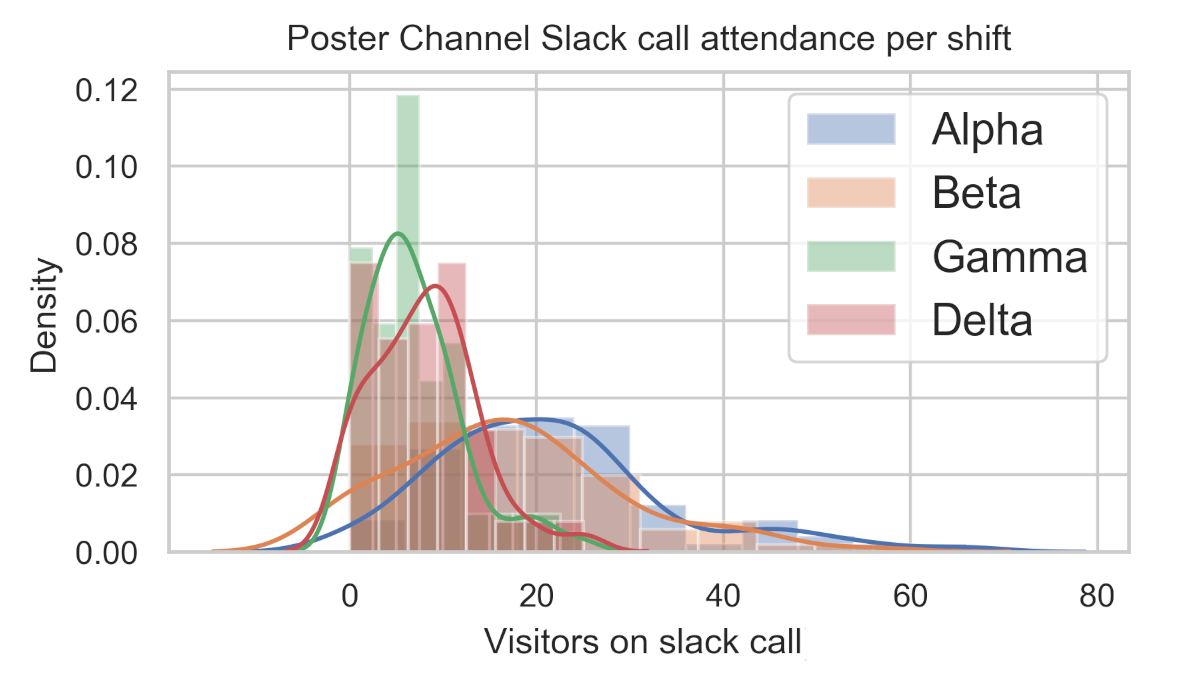
The 24 hr schedule was designed to ensure participants could have the full conference experience from any time zone represented in our registrants. The schedule was organised in two sets of shifts, spaced 11.5 hrs apart, with the Alpha-Gamma and Beta-Delta pairs offering the same poster sessions and main conference presentations such as keynotes. From the activity in slack channels, we found a significant difference in attendance levels for the poster sessions, with the first of both double sessions consistently more busy than the second. This difference in demand seems to be a mix of time zone concentrations and a kind of premier effect, and would be worth planning around in the future.

The post conference survey was answered by about 20% of attendees and they shared many useful comments about the experience. Top of mind was how this style of virtual conference compared to what the community was used to.  On many points, the loss of in-person contact was keenly felt, but some aspects of this Slack-supported virtual experience were preferred by a solid minority.

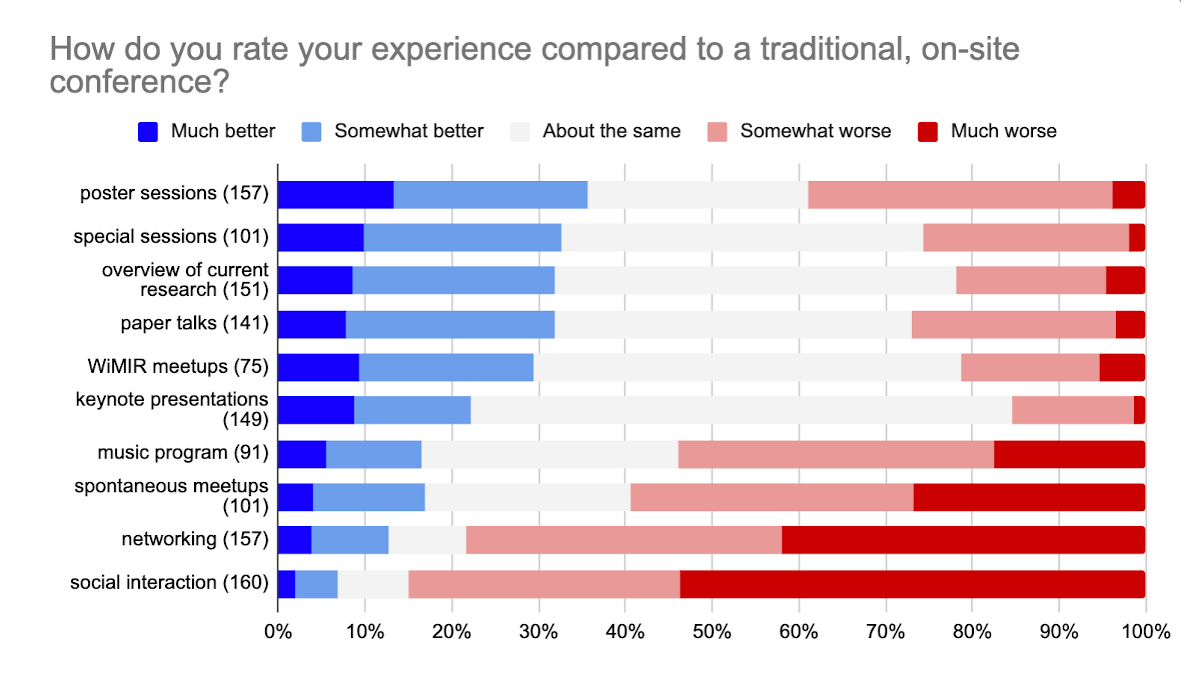
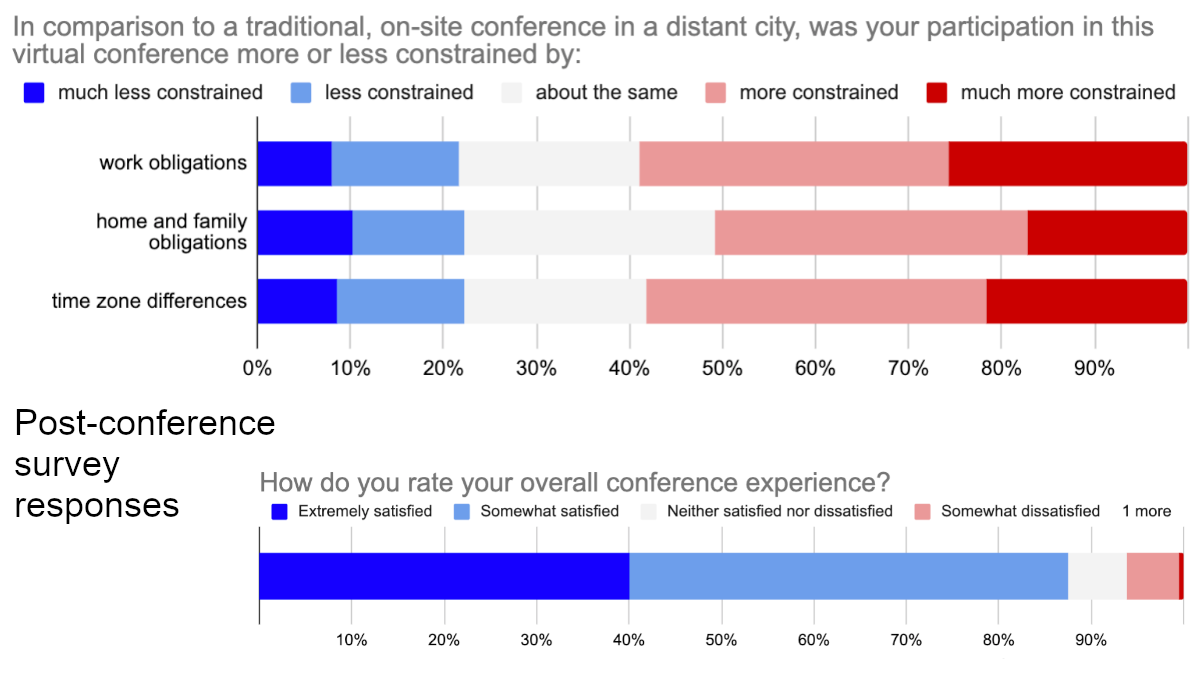
Besides noting the limitations of the conference design and platforms, it’s worth noting that some of the differences in experiences reported are a consequence the conditions from which people were participating. Most were at least somewhat more constrained by the practicalities for attending without leaving their work and home. But despite all that was new and challenging about this way of conferencing, we were very happy to see that most survey respondents were still at least somewhat satisfied by the experience provided.

Please see the report for more survey results and analysis of participation, details of how the conference was designed, what we might suggest doing differently, and full credit to the many people who made ISMIR 2020 a success.

Updated Activity Analysis, 2.1

Updated version of the Activity Analysis toolbox is up on GitHub now. The changes in functions came from working with more psychophysiological measurements and events. Now there is an option to assess the coordination score for a response collection using the distributions of local rank in activity levels, instead of the distribution of activity levels themselves. For more on Activity Analysis generally, check out this post on the paper that was published earlier this year, including a link to the full text pdf.

This addition may seem like a tiny adjustment. For many kinds of response events, it doesn’t substantially change alignment assessments. When considering the coordination of events that are fairly consistent in rate over time, like say inspiration onsets, the distributions of activity levels and of local rank give the same kinds of coordination scores. However, for response events that change their rate of occurance over the course of a piece of music, like skin conductance increases, the activity level time series distribution obscures moments of exceptional alignment in quieter times. In such cases, the local rank does a better job at capturing anomalous alignments.

This rank based coordination score appeared to be necessary when I was testing unrelated response collections of facial sEMG signals and skin conductance. The old calculation generated scores that were too low, producing insufficient numbers of false positives, while this adjustment behaved just as the statistic should.

Besides this change to the localActivityTest function outputs, a few other functions have been tweaked and the demos have been amended to work with these changes. Lastly, Demo_2 now include coordination assessments on a number psychophysiological signals recorded during 24 listenings to a fun piece of music by a single participant.

It all should work just fine in MatLab.

I’m looking forward to releasing this version in Python in the not too distant future too.

PhD Defended

On June 21st, 2018, I successfully defended by doctoral dissertation, Detection of Respiratory Phase Adaptation to Heard Music.  Without a doubt, listeners do subtly and subconsciously adjust when they breathe to fit with music, lining up specific respiratory phases to specific moments, but this happens under limited conditions. Only some moments of music draw respiratory phase alignment, and some people show stronger susceptibility to music’s coordinating influence.

With the extra three months granted by my committee, my quantitative analysis of listener respiration was extended with qualitative analysis of alignment patterns in repeated response studies and audience experiments. Activity analysis identified moments of exceptional phase alignment and music theory enriched my interpretation of the corresponding stimulus. Out of 36 pieces of music, 21 provoked identifiable moments of alignment and out of these arose four theories of how listeners’ breathing could be drawn or cued by what they heard:

  • Embodied perception/motor imagery: Some listeners toke inspirations when they might have, were they performing the music. This happens to vocal music, whether or not the performers’ breaths could be heard in music recordings. Examples from one case study participant can be seen in the attached figure, with inspirations (blue stars on chest expansion measurements) coinciding with performer inspirations during this a cappella folk song (highlighted in red on sound wave).
  • Inspiration suppression for attentive listening: The noise of inspiration and expiration can get in the way of auditory attention and there are (rare) moments in music when listeners seem to delay breathing in or out so as to hear better. A moment like this is also in the attached figure, with post-expiration pauses extended from 97.4 s.
  • Respiratory marking of salient moments: Listeners would sometimes breath in our out with recurring elements of musical motives, as if acting with something important or familiar. This was more common in structurally complex music and moments of strong affect, such as powerful lyrics, increasing tension, or exceptional aesthetics.
  • Post-event respiratory reset: In a few cases, well timed respiration cycles occurred after events, like after the last line of a song. This is reminiscent of relaxing sighs and similar actions through to help the respiratory system reset back to normal relaxed quiet breathing.

Causal mechanisms for these four theories are suggested by current respiration and music cognition research, however they each require further exploration on experimental data beyond what was studied here. And it is also possible they might arise more frequently than could be captured by these statistics, limited as they are to behaviour that co-occurs with the music at least 20-40% of the time. Between a theorize mechanism and well designed experiments, it may yet be possible to detect these deviation in action, giving us further clues into how listeners are engaging with the music they hear.

More details to come in the shape of my final dissertation document. To be completed in the next month or so.

Activity Analysis published in Music Perception

The Activity Analysis paper has been published in Music Perception!

Titled “Activity Analysis and Coordination in Continuous Responses to Music”, this paper explains what we can learn about the consistency of activity in continuous responses to music using the example of Continuous Ratings and (with the appendicies) all the technical details behind the results.

Abstract: Music affects us physically and emotionally. Determining when changes in these reactions tend to manifest themselves can help us understand how and why. Activity Analysis quantifies alignment of response events across listeners and listenings through continuous responses to musical works. Its coordination tests allow us to determine if there is enough inter-response coherence to merit linking their summary time series to the musical event structure and to identify moments of exceptional alignment in response events. In this paper, we apply Activity Analysis to continuous ratings from several music experiments, using this wealth of data to compare its performance with that of statistics used in previous studies. We compare the Coordination Scores and nonparametric measures of local activity coordination to other coherence measures, including those derived from correlations and Cronbach’s α. Activity Analysis reveals the variation in coordination of participants’ responses for different musical works, picks out moments of coordination in response to different interpretations of the same music, and demonstrates that responses along the two dimensions in continuous 2D rating tasks can be independent.

Download the PDF (Upham_McAdams_2018_ActivityAnalysis) and get the MatLab toolbox to use this technique on more continuous response data.

Million thanks to my co-author and mentor, Prof. Stephen McAdams, whose steadfast support made this work possible, and the patience of our editor at Music Perception, Prof. David Temperley.