(This is post is derived from a poster presentation at the 14th International Conference of Music Perception and Cognition, hosted in San Francisco, CA, USA, July 4th-9th, 2016)
Music listeners often fall into quiet breathing and yet music has been shown to influence when individual listeners inhale. Here is an explanation of how deviations in quiet breathing can be measured in the respiratory sequence, and tests of how these deviations can depend on the musical work.
Defining Quiet Breath
When we are at rest and not preparing to act or thinking about acting, our bodies generally fall into the state of quiet breathing:
- Moderate depth
- Short inspiralation, ~1 s
- Short elastic expiration ~ 2.2 s
- Stable periodic cycle
Quiet breathing is efficient and discrete, a respiratory sequence that does not require attention or conscious control. Compared breathing behaviour during physical actions, the regularity of quiet breathing suggests that it should be relatively easy to model.
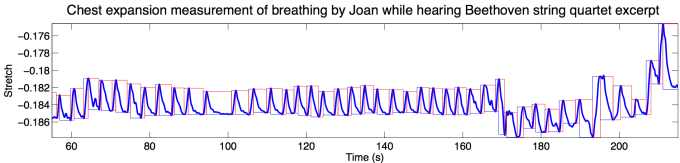
A model of quiet breathing is constructed per participant and listening session. A template quiet breath is defined by the median depth and duration of inhalations and exhalations across breaths recorded during music listening. The rate of breaths per minute is effected by arousal, as has been shown in a number of studies using music as a stimulus. The model is then a composite of the template breath and the latest quiet breath.
In most studies of breathing in music listeners, we can assume that these participants were performing quiet breathing most of the time the music was playing. As such, changes in breaths per minute associated with the arousing effects of music would result in changes in the
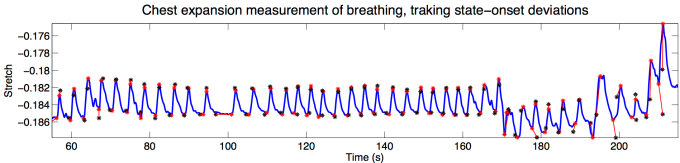
Capturing Respiratory Deviation
Compromise between current state of the system (bodily arousal, recent disruptions) and the typical quiet breath. Deviation criteria used here were all differences from
- Inhalation duration: average of standard Inhalation and last normal* inhalation.
- Exhalation duration: standard ratio to last inhalation and last normal*exhalation
- Inhalation depth: difference from last normal* exhalation
- Exhalation depth: difference from last normal* inhalation
Last “normal” breath is the last apparent quiet breath in the sequence. None quiet breaths were excluded using thresholds
The analysis makes use of deviations exhalation duration and inhalation depth.
****
Measuring deviation from Quiet Breathing and the intrusion of active breathing, can we tell:
- do these deviations related to the music heard?
- do they correlate with the listeners’ attitudes to the music?
Stimuli dependent disruptions to attentive breathing
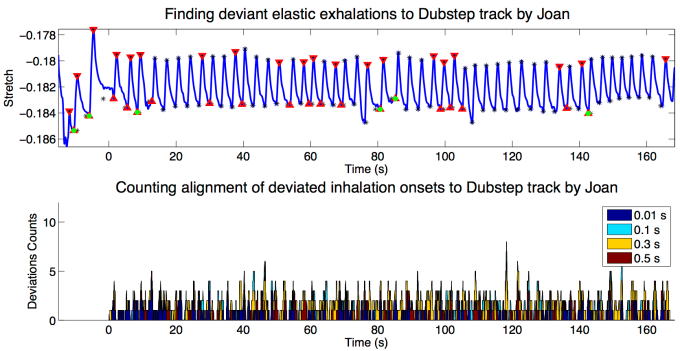
Previous work has measured stimulus-alignmented inhalations by some listeners to some pieces of music over repeated hearings.
For this to occur, the music must influence when a listener breathes, encouraging adjustments to their normal attentive breathing. Because this depends on the stimulus:
Hypothesis – The amount of breaths disrupted per listening depends on the music heard. Tested by measure the duration of time outside of normal quiet breathing per listening.
Participants
Avid music listeners were recruited for an experiment on emotional responses to music. Participants were selected to vary in musical training and physical activity,
- Charlie: music listener without any musical training or performance experience. She also had no athletic training.
- Joan: Performing pianist, singer, and violinist studying film scoring. She had some dance training, occasionally practiced yoga, and ran semi-regularly.
- Marcus: music listener without musical training, but some performance tendencies. He was a varsity athlete with a regular fitness routine.
- Ricky: Audio engineer and former guitarist. He also had been a competitive rugby player and worked out regularly.
Listening Sessions
Over six weeks, all participants attended 12 listening sessions. They were asked to listen as they would normally when at home, alone.
Their responses to the stimuli were measured via:
- Psychophysiological sensors: sEMG of Zygomaticus, Corrugator, and Trapezius, Respiration belt, Skin conductance, Photoplethsmography, Finger temperature)
- Post-stimulus questionnaires: ratings of Attentiveness, Liking, Familiarity, events like sneezing and chills, text notes.
- Continuous ratings of emotional response, Arousal and Valence, during half of the sessions, alternating.

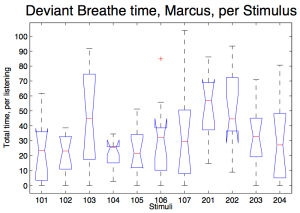

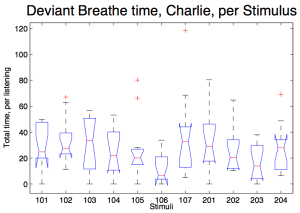
Figure 4 – 7; Whisker plots of the total duration of disrupted breathing per stimulus across the 12 listenings for each of the four case studies.
Result
For three of four case studies, a one factor anova found significant differences in the duration of disrupted respiration.
For the last participant, Ricky, the breath parsing algortithm does noe perform well. The null result may change with better treatment of signal.
What, then are the nature of these disruptions? are they from:
- inattention?
- unaligned deviation active breathing?
- aligned changes in quite breathing?
Charlie
Source SS df MS F Prob>F
------------------------------------------------
Columns 6537.6 10 653.757 1.7 0.0887
Error 46595.7 121 385.089
Total 53133.3 131

Joan
Source SS df MS F Prob>F
--------------------------------------------------------
Columns 59941.3 10 5994.13 10.42 1.54419e-12
Error 69600.1 121 575.21
Total 129541.5 131

Marcus
Source SS df MS F Prob>F
--------------------------------------------------------
Columns 59941.3 10 5994.13 10.42 1.54419e-12
Error 69600.1 121 575.21
Total 129541.5 131

Ricky
Source SS df MS F Prob>F
--------------------------------------------------
Columns 6812 10 681.204 0.83 0.6005
Error 99299.5 121 820.657
Total 106111.5 131
Stimuli
List of stimuli for the 4 Repeated Response Case Studies. The last four pieces were suggested by subjects from their favourite music.
101 String Quartet, Classical (Beethoven Op. 131, ii-iii / Artemis Quartet)
102 Funk, Instrumental (Stampede / Quantic Soul Orchestra)
103 Singer/Songwriter (Basket / Dan Mangan)
104 Electronic Dubstep (1685/Bach / Nosaj Thing)
105 Choral & Orchestral, Dramatic (O Fortuna, Carmina Burana/ OSM)
106 A cappella, Folk (Le rosier de trois couleurs /Strada)
107 Spoken Word (Visiting Hours/Shane Koyzan)
201 Calm with Vocals
202 Energetic with Vocals
203 Energetic, Instrumental
204 Calm, Instrumental
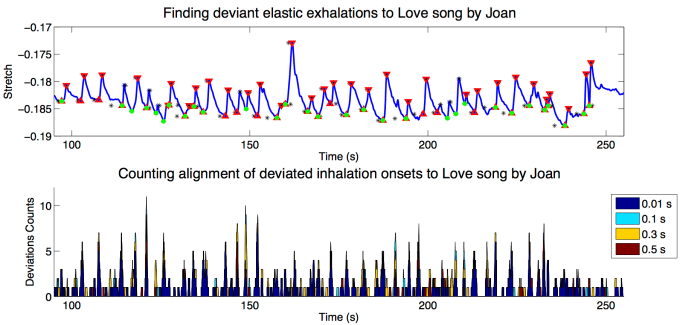
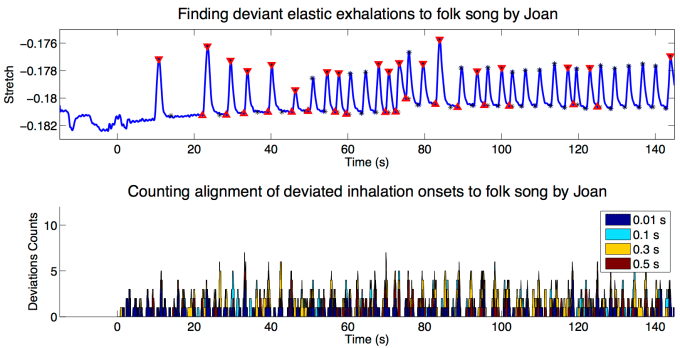
Although deviations are not too common, they align across listening significantly for moderate sized deviations. These occurred mostly within a quiet breathing state.
Correlates to Disruptions?
The initial hypothesis was that the amount of disruption would correlate with inattention. However:
- Ratings of focus did not correlate significantly with the amount of disrupted respiration per listening.
- Nor did it correlate with liking or self consciousness, also collected after every listening.
Separating the different types of disruption might yield a different results, as should be explored in future work.
